Overview
During your onboarding you learned how to easily mask vegetation and water using Marigold's t built-in tools. However, it is common for other elements, such as snow and ice, shadows, agriculture, or human development to present more complex masking hurdles. This article covers examples and approaches to these challenges and provides you with tips for you to mask your own AOI in Marigold.
Snow and Ice
Permanent snow and ice features such as glaciers can present unique challenges for masking due to their variability in appearance. The best approach for isolating and masking glaciers within an AOI is often k-means clustering, an unsupervised classification method that groups pixels into a chosen number of classes based on their spectral similarity.
Tip: if you have accurate vector data for permanent snow and ice in your area, try importing the polygons in a geoJSON file and mask your glaciers using the new vector masking capabilities in Marigold 2.0!
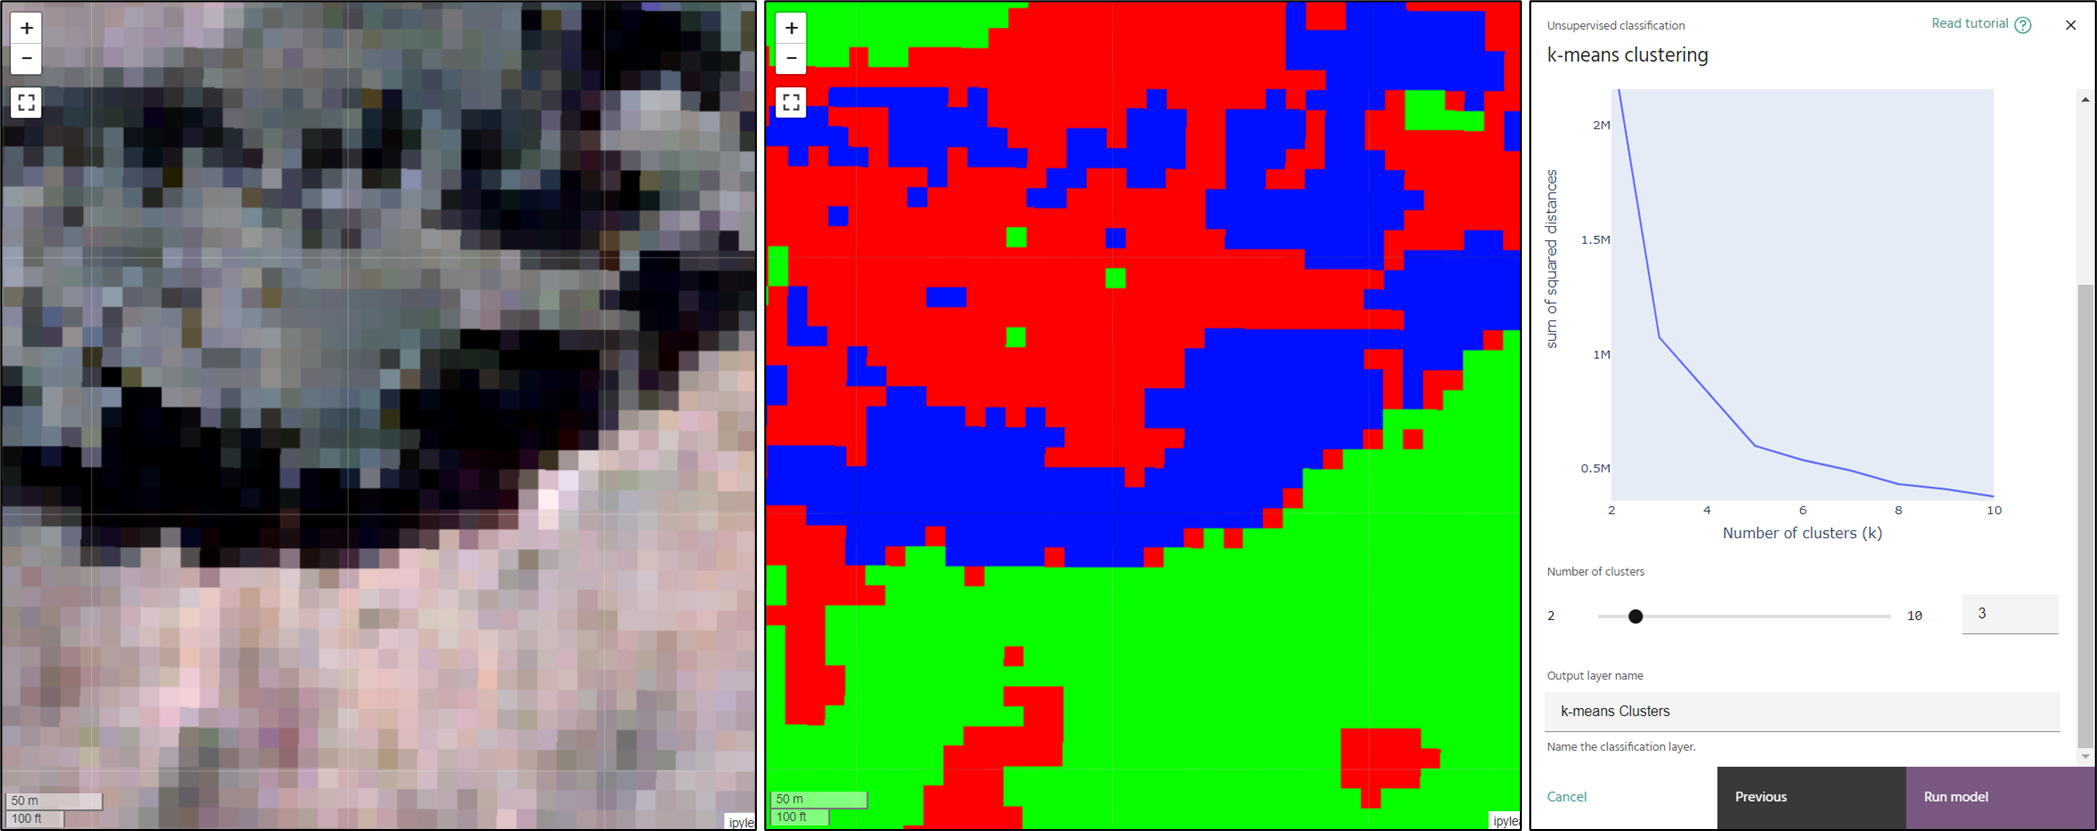
Zoom into a glacier in the area you would like to mask. Navigate to the k-means clustering tool under Classification on the right hand Processing Toolbox. Select the imagery product you intend to analyze, and check the Standardize input product option. This ensure the same parameters are applied if you zoom elsewhere on the map. Select the bands you would like to use for the clustering classification, in most cases the VNIR and SWIR but not the TIR bands are appropriate. Next, click the "Train Model" button at the bottom to continue to Step 2.
In Step 2, use the slider to adjust the number of clusters while observing the affect on the map.
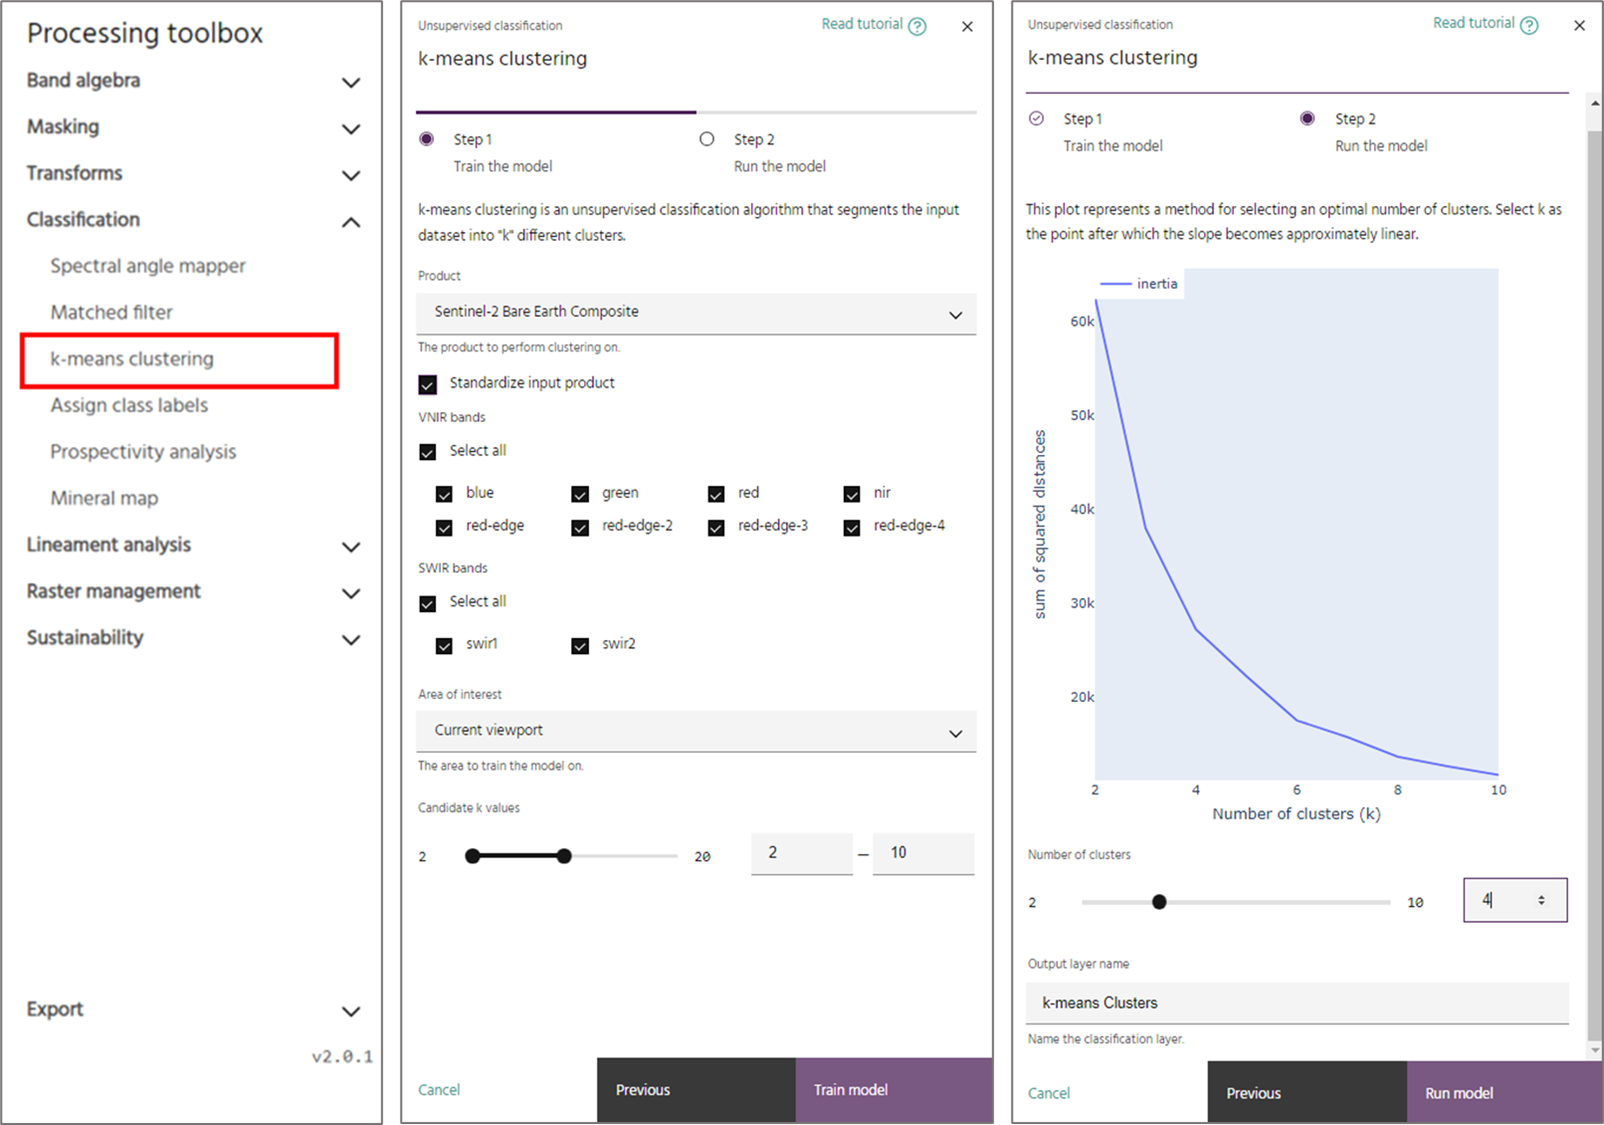
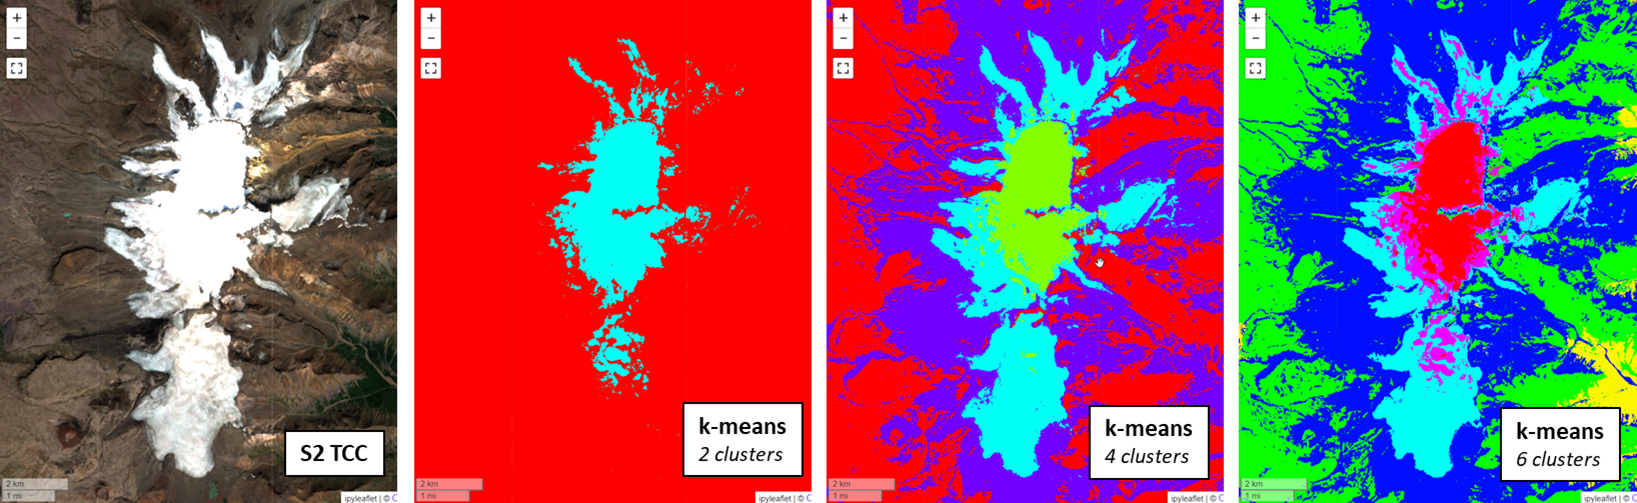
In the example below, the results of k-means clusters with 2, 4, and 6 classes are shown using Sentinel-2 data an an input. Comparing to the original imagery, you can see that using four clusters isolates the glacier into only two classes shown in teal and green. Two clusters does not provide enough differentiation, and six clusters adds additional detail that isn't needed. When satisfied, click the Run model button a to add the results as a layer to your project.
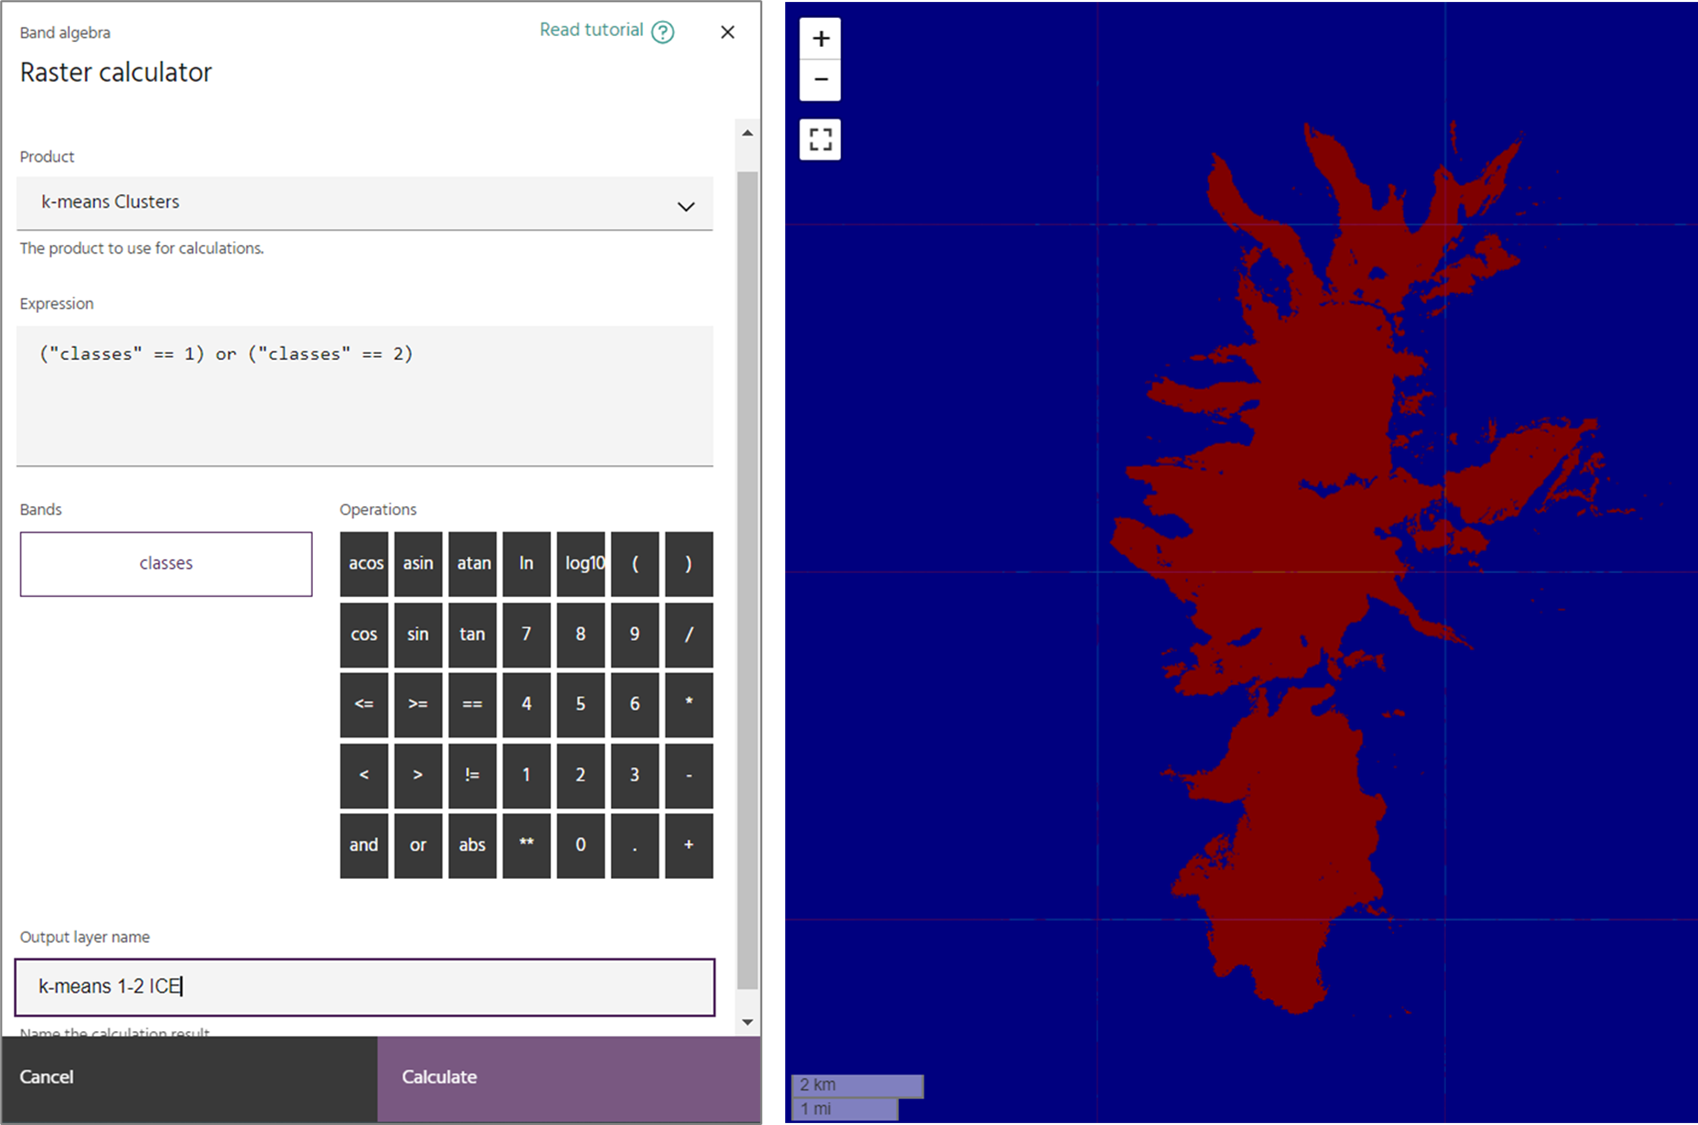
To combine the k-means clustering classes into a masking layer, use the pixel inspector to identify the value of the colors you would like to mask, in this case the value are 1 (green) and 2 (teal). In the Processing Toolbox select Raster Calculator under Band Algebra. Input an Expression that isolates the classes of interest. You will need parenthesis and the logical operator "or" to select multiple classes. The result will be a binary raster layer with values of 1 corresponding to the areas you intend to mask.
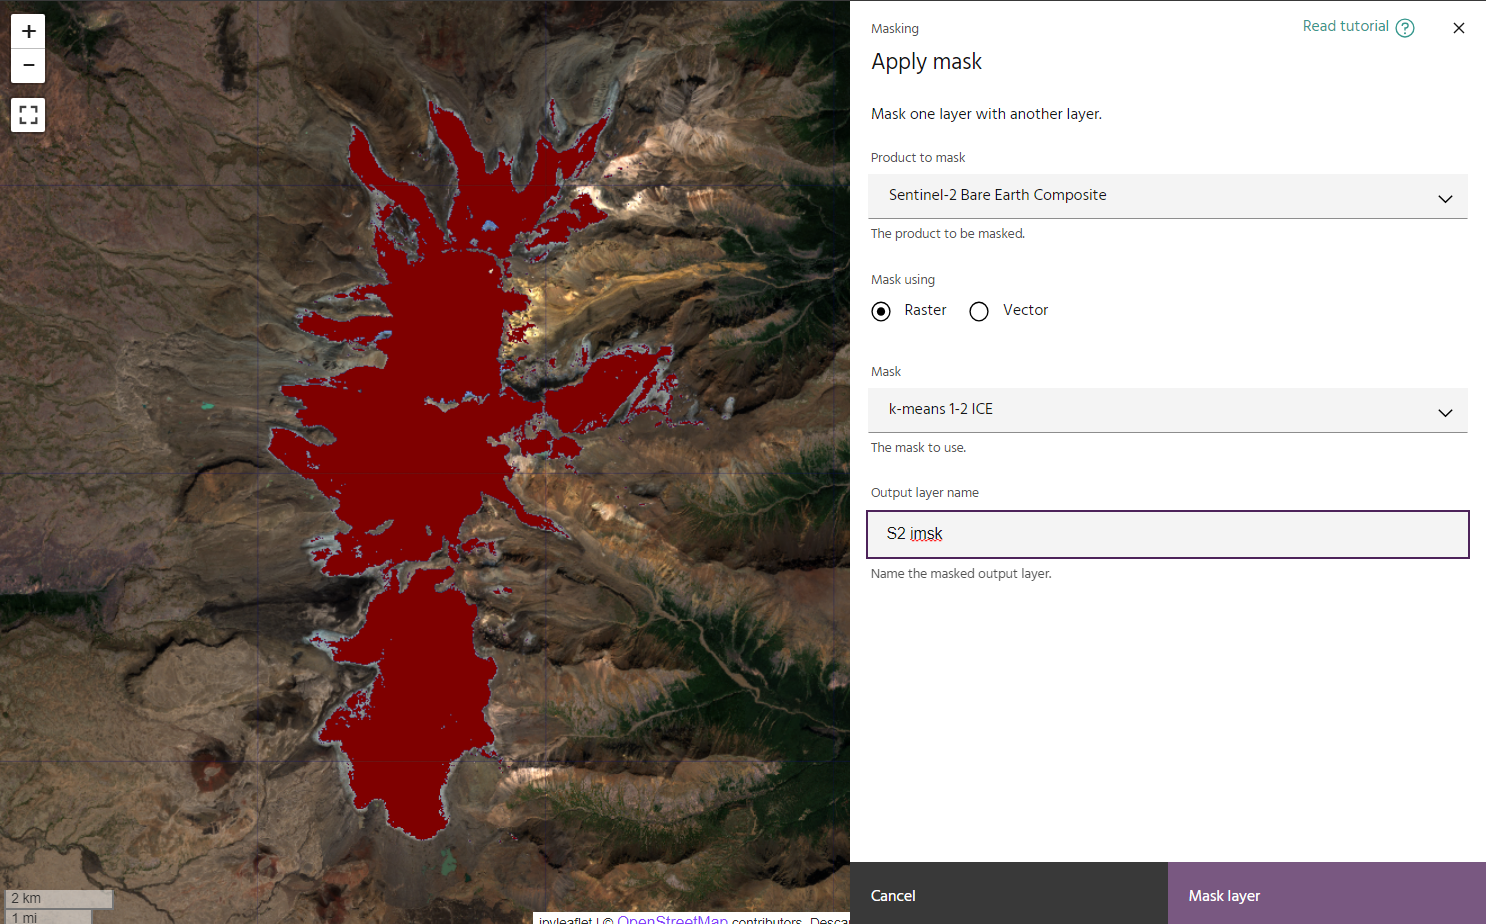
Finally, apply the result you have created as a mask. Under Masking, Apply Mask, select the product to mask and the results of your calculation to produce a new output that now masks any snow or ice in your scene. Look around to ensure you have removed everything that you intended.
Shadows
When working in mountainous terrain it is common for shadows to be present in your imagery, especially at extreme latitudes. The low reflectance present in shadowed areas provides potential for false negatives and positives in your interpretation if they are not masked prior to analysis.
Again, performing a k-means clustering is often the best approach to masking these areas. Follow the steps above to focus on an area of shadow in your image and perform a k-means clustering classification to isolate the areas you would like to mask.
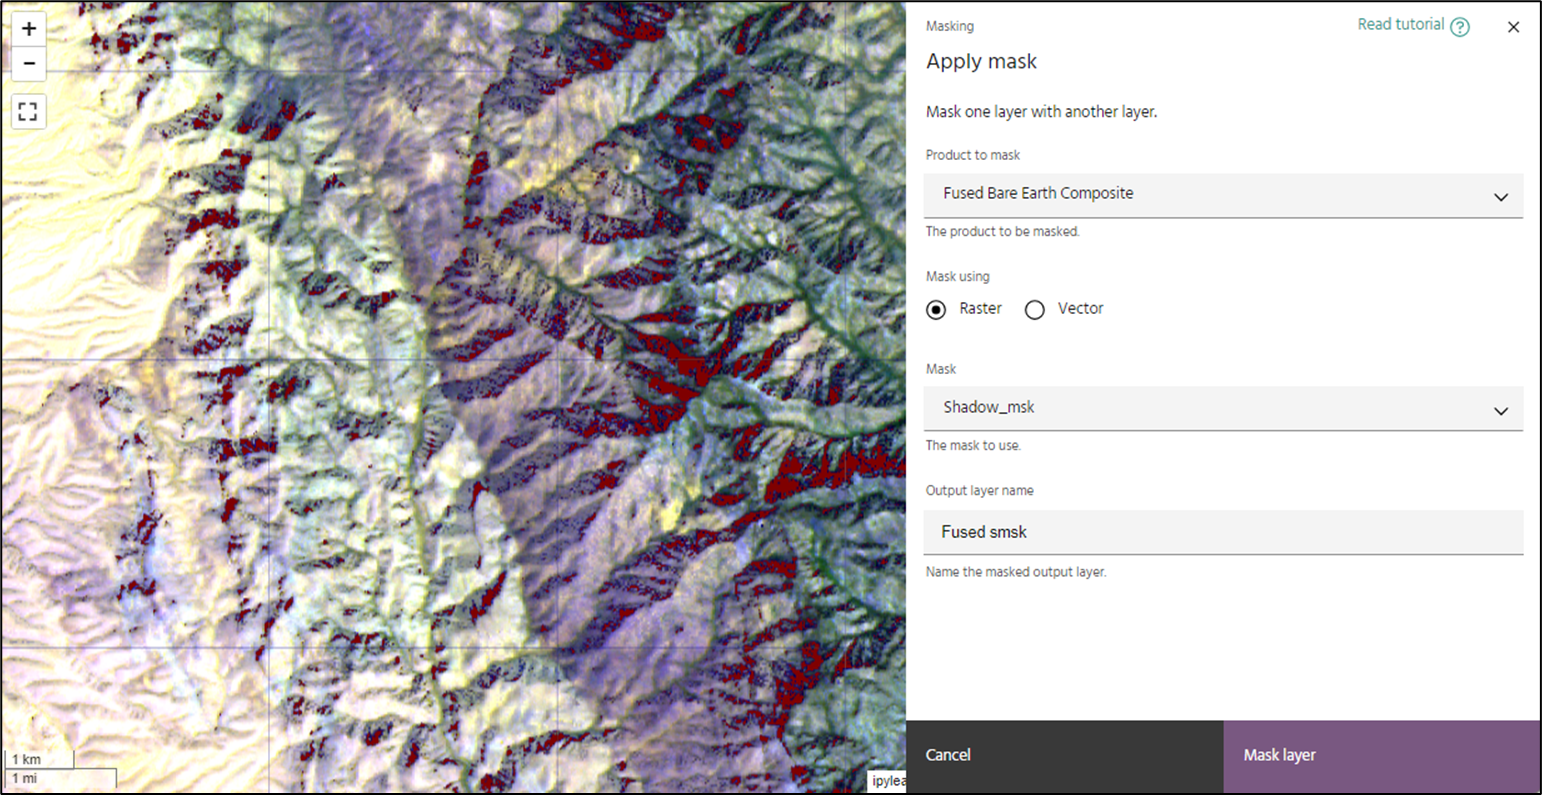
Trial and error is key here, you may find that using a small number of clusters - like 3 or even 2 - works best. In the example below, three classes does a very good job of identifying the shadowed areas, shown in blue.
Look around the extent of your AOI to ensure your results have worked as intended elsewhere in your scene. Apply the mask to your chosen input product.
Vector masking
Sometimes, the area you are interested in will contain complex features such as mine infrastructure, agriculture, or urban development. These areas are not as easy to identify through machine learning methods like k-means clustering and are often more easily masked by hand. This is where the new vector masking feature can be implemented.
Either import a geoJSON file or create a new vector layer and draw a polygon around the areas you would like to exclude. This can be as simple or detailed as necessary. In the Apply mask tool menu, toggle to the vector setting and select the vector mask layer you intend to use and apply the mask.
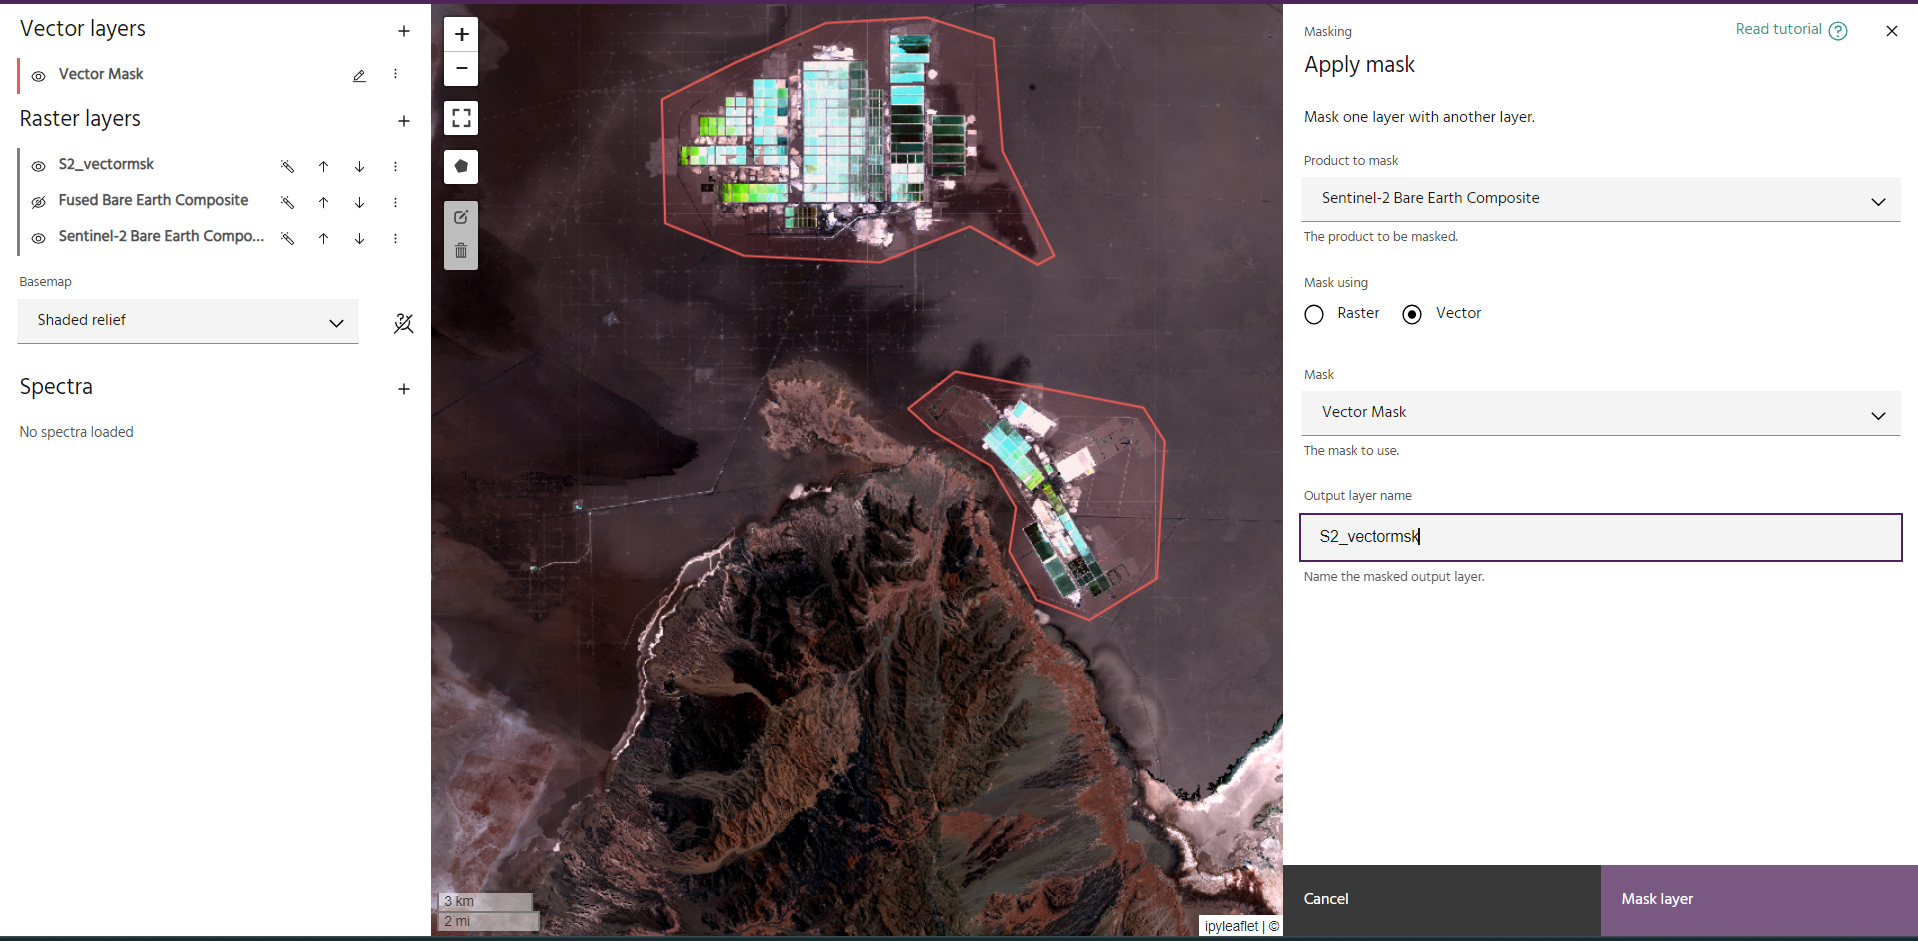
The new vector masking tool also works well when using complex polygon features that can be imported into Marigold as geoJSON files. Polygons containing mapping data for glaciers, water, salars, or alluvium can easily be applied as masks to your data to help you focus on the pixels that matter.
Tips and Considerations
- Think about the time of image acquisition for your data products and whether that will impact how you approach masking. Remember that all ASTER SWIR imagery was collected prior to April 2008. In some cases, a significant feature, such as a mine, may be present in S2 imagery but not in the ASTER. Either mask the feature entirely, or remember this fact during your interpretation.
- Similarly, many glacial features have receded significantly in the past decade. Keep that in mind when comparing ASTER and Sentinel-2 imagery with the Satellite Imagery base layer
- It can be tricky to isolate features with k-means clustering when the boundaries are not very sharp. Try zooming very close to your feature so that the viewport contains ~50% feature you would like to mask.