EarthDaily is proud to release a milestone feature to help our users get the most out of spaceborne and hyperspectral imagery with our new Compositional Mapping tool. This tool, built with a combination of modern academic methods and in-house knowledge and research, allows geologists to rapidly map the occurrence and composition of key minerals like white mica, kaolinite, and chlorite to build alteration models that advance their exploration targets.
Additionally, you’ll find quality-of-life improvements like KMZ/KML upload, enhanced raster-to-vector settings, a streamlined and expanded PCA workflow, support for exporting spectra into ENVI format text files, and dozens of performance improvements.
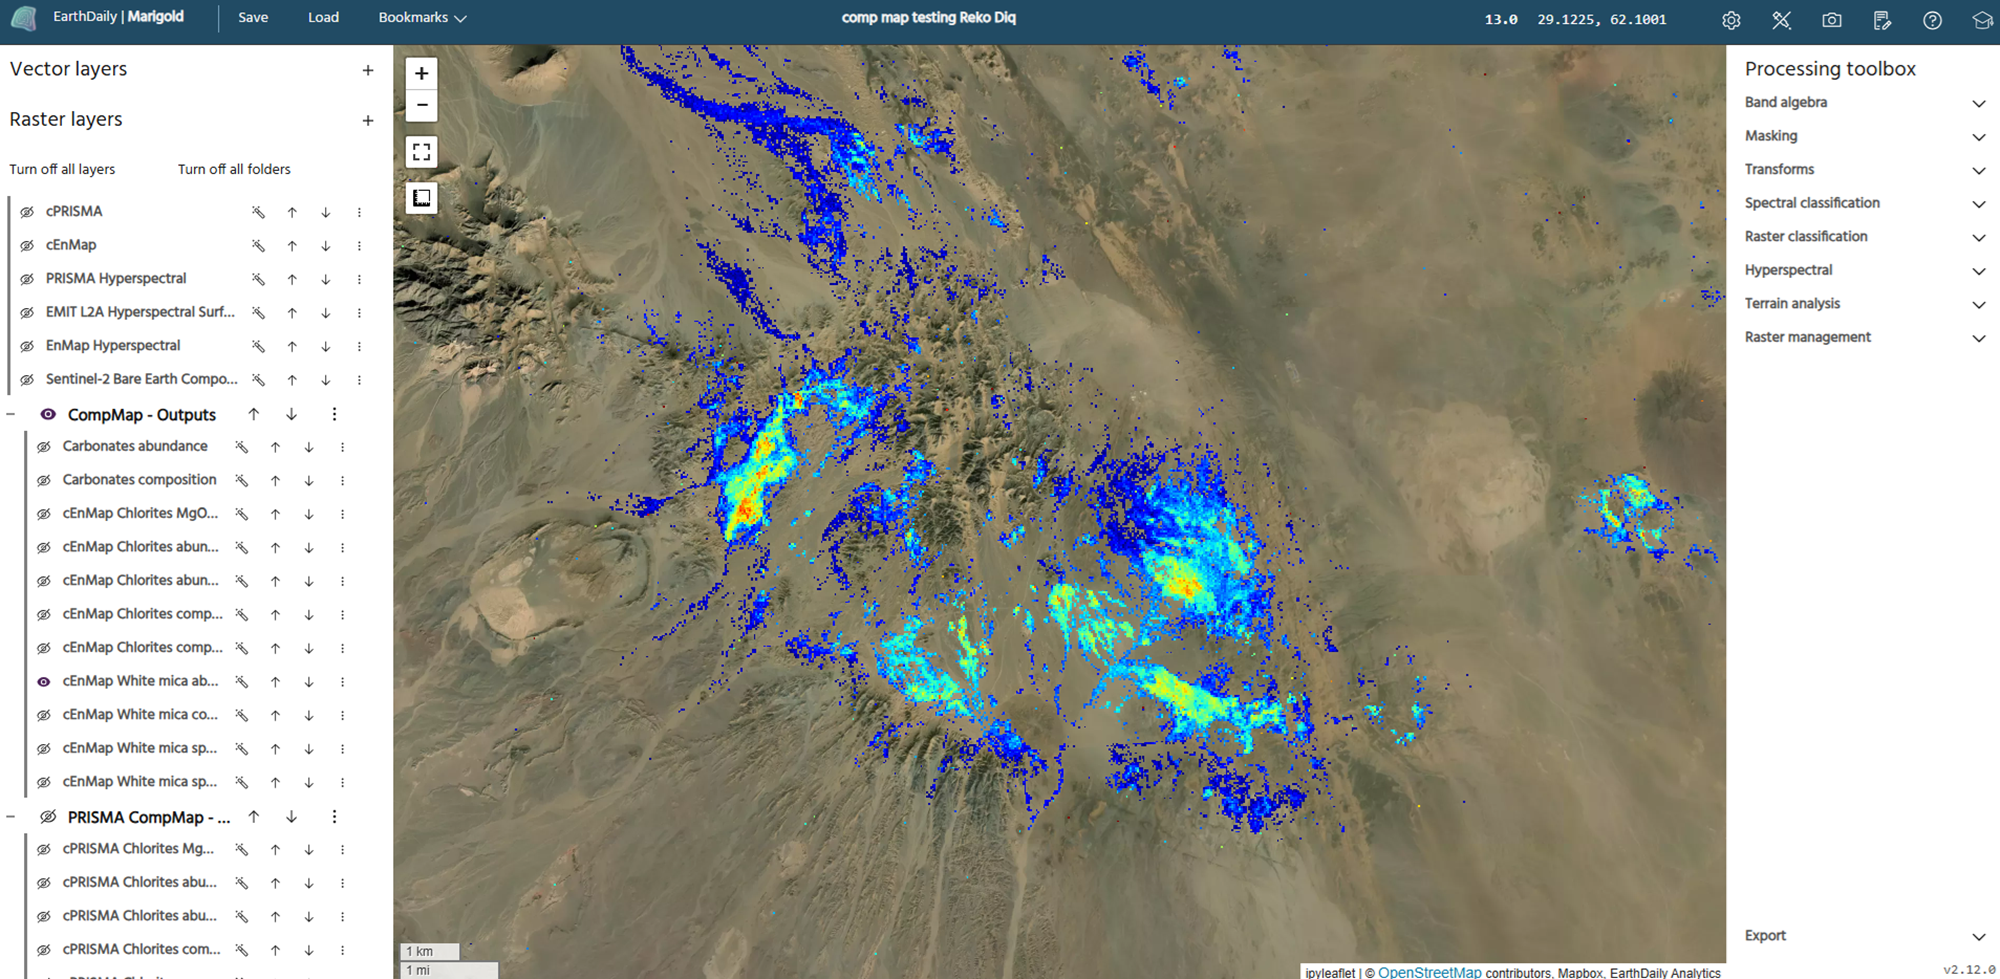
Compositional Mapping Tool
As Marigold expands its hyperspectral data catalog, more users than ever want to quickly and efficiently map the presence and composition of key alteration minerals across their areas of interest. In this first release, we are proud to provide mapping capabilities for three minerals associated with hydrothermal alteration and associated deposits:
- White mica, abundance and composition
- Kaolinite, abundance
- Chlorite (MgOH), abundance
For a run-down of how this tool operates, visit Marigold's documentation page and to see an example of the tool in action mapping white mica at Reko Diq porphyry complex, Pakistan, see this guide.
Mineral Abundance and Composition Mapping Theory
The compositional mapping tool works on all of our hyperspectral products that have sufficient band coverage in the SWIR. In simple terms, it works by analyzing each spectrum in the scene and looking for the presence or absence of absorption features that either qualify or disqualify the pixel for that specific mineral. For example to identify white mica, the tool looks for an absorption feature around 2200 nm and 2350 nm, while also checking for the absence of a feature at 2160 nm that may indicate kaolinite instead. Once identified as white mica, the composition is measured by mapping the wavelength position of the ~2200 nm absorption feature between paragonitic (~2180 nm), muscovitic (~2200 nm), and phengitic (2219 nm).

Two spectra collected from EnMap data in Marigold. These spectra both show absorption features in the ~2200 nm and 2350 nm range, and do not have an absorption feature at 2160. They map as white mica, with different compositions.
Using the Tool
To use the tool, load hyperspectral imagery from the Marigold Catalog; EnMap, PRISMA, EMIT, AVIRIS, or proprietary hyperspectral imagery. Then open the Compositional Mapping tool, found under the Hyperspectral header in the Processing Toolbox.
Tip: the outputs from the tool will be created in a folder system, which will be created below any un-foldered layers. To visualize results above your imagery, add your source data to a folder prior to running to tool.
To create your outputs, select your source product and click your desired mineral. Results will automatically be generated in your layer list. A sliding parameter that filters the minimum absorption depth of the spectra is provided to tune the output result. A higher threshold here will result in fewer mapped pixels. Add a unique name to your layers to help you keep track of results.

Stay Tuned
We are currently testing and validating results of more minerals and they will be added to the tool in the coming weeks when ready. Additionally, an advanced version of the tool is in the works to give users complete control over the parameters and thresholds in mineral mapping.
Remember, all remote sensing mapping results should be taken in context with local geological knowledge and field validated when possible. Reach out to Marigold support or your company's EarthDaily contact lead to help setup dedicated training for the theory and use of this tool.
Additional Updates
- KML / KMZ upload support
- Marigold now allows users to upload more vector types. Complex KMLs with mixtures of points, lines, and polygons will be separated into individual vector layers.
- Vectorize classified layer
- This popular tool that allows users to generate permanent vectors from their classified raster layers now has more intuitive parameter choices to control minimum polygon size.
- Principal Components Analysis (PCA) dialog
- The PCA dialog will now automatically generate the results without needing to apply them.
- Additional statistics, including eigenvectors, eigenvalues, and percent explained variance.
- Spectra export additions
- Spectra can now be exported as ENVI formatted .txt files to allow quick ingestion into other platforms. To export spectra in this format, click the + icon next to Spectra and select Download MG spectral library and select the .txt format for your chosen spectra.
- You can also now download the latitude-longitude coordinates for any spectra you sample. To do so, click the three dots next to the spectra and select "download geometry" from the dropdown menu.
